You can’t manage what you don’t measure.
In hospitality, small daily shifts — A slow Tuesday, an overstaffed Friday lunch, a spike in food cost from one supplier — add up fast. Yet many operators still rely on end-of-month P&Ls to understand performance. By the time those numbers arrive, it’s too late to fix what went wrong.
With the tech we have today, there’s no need to wait 30 days for clarity. Real-time data from your POS and reservation systems makes it possible to review daily restaurant performance metrics and adjust immediately.
In this guide, we’ll be covering the key restaurant metrics for owners that actually matter. No overwhelming accounting data, just practical, data-backed restaurant KPIs to track daily that fit into a simple daily restaurant reporting dashboard and can be reviewed in 10 focused minutes before service.
Because in hospitality, small daily decisions drive big annual results.
What are restaurant KPIs (and why tracking them matters)
Restaurant KPIs (Key Performance Indicators) are measurable metrics that show how your venue is performing against its goals. They translate activity such as covers, sales, labour hours, bookings into clear signals about operational health.
At their core, restaurant KPIs answer one question: Is the business moving in the right direction?
There are two important types to understand:
- Lagging indicators: These show what has already happened, important but reactive such as total monthly revenue, last month’s food cost percentage, quarterly profit.
- Leading indicators: These signal what’s about to happen. These are proactive and give you time to adjust before small issues become expensive problems. For example, forward bookings, daily labour alignment, average spend trends, no-show rates.
When you track restaurant KPIs daily:
- Labour stays aligned with revenue.
- Food cost fluctuations are caught early.
- Booking gaps are addressed before they hurt cash flow.
- Profitability becomes predictable, not hopeful.
Hospitality will always have variables you can’t control — weather, seasonality, market shifts. But daily KPI tracking gives you control over the variables that matter most.
And that’s what separates reactive operators from resilient ones.
The core daily restaurant KPIs every owner should monitor
To stay ahead in a busy restaurant, it helps to keep a close eye on the right numbers every day. Here’s a breakdown of the key stats to track so you can spot issues early, protect margins, and keep guests coming back.
Front-of-house KPIs
As someone who works closely with restaurant operators through our management platform, we see every day how the smallest tweaks — staff deployment, upselling prompts, or reservation pacing — can have an outsized impact on revenue.
These front-of-house KPIs aren’t just numbers in a dashboard; they’re actionable signals that help operators make decisions in real time.

Daily revenue
Daily revenue is your top-line pulse. It shows if you’re trending up, flat, or down and lets you act fast instead of waiting for month-end reports.
If last Thursday’s revenue was $8,500 and today it’s tracking at $6,900 by 7pm, that’s an early signal to investigate. Was there a large cancellation? Fewer walk-ins? A staffing slowdown affecting table turns?
Why it matters
- Shows overall business health.
- Highlights demand trends by daypart.
- Reveals immediate performance shifts.
Metric: Total daily sales
Daily review
- Compare against same day last week.
- Review lunch vs dinner performance.
- Flag unexpected dips early.
Covers (guest count)
Covers show how many opportunities you actually had to generate revenue. Revenue rarely drops randomly, it usually follows covers. If traffic is consistently light between 3–5 pm, that’s not bad luck, it’s insight. It could point to a marketing opportunity, a staffing adjustment, or a pricing tweak.
With Now Book It’s real-time booking diary, you get a live view of availability and can assign roles to your reservation team, making it easier to manage covers, spot gaps, and act before slow periods impact revenue.
Why it matters
- Indicates demand and traffic flow.
- Impacts staffing alignment.
- Affects revenue forecasting.
Metric: Total number of guests served per day.
Daily review
- Compare booked vs walk-in guests.
- Review actual covers vs forecast.
- Identify underperforming time slots.
Average spend per guest (average check)
This is where profitability really starts to show up. If average spend dips, it’s usually telling you something: fewer drinks? No desserts? More discounting than planned?
We’ve seen restaurants increase profit without increasing covers simply by lifting average spend through better menu placement, server prompts, or bundle offers. A $4 uplift per guest across 180 covers adds up fast.
Why it matters
- Directly influences profitability.
- Reflects upselling effectiveness.
- Highlights menu performance shifts.
Formula: Total revenue divided by total covers = average spend per guest
Daily review
- Compare against target average spend.
- Track upsell item performance.
- Adjust server suggestions or promotions if needed.
Table turnover rate
Turnover is often invisible until it hurts revenue. Sometimes teams assume they need more marketing, when the real bottleneck is operational. Even small friction points quietly limit how many guests you can serve.
Technology can make a real difference. Now Book It’s table management system lets you streamline service with seamless layouts or section views, giving full control over covers and time slots.
Combined with tools like self-order kiosks, KDS, and AI-driven POS systems, it can cut back-end friction by 15–20%, keeping tables moving and boosting covers without adding extra seats.
Why it matters
- Maximises revenue per service.
- Improves seating efficiency.
- Reveals service bottlenecks.
Formula: Total covers divided by total available seats = table turnover rate
Daily review
- Monitor slow table dwell times.
- Identify payment or service delays.
- Assess peak-period pacing.
RevPASH (revenue per available seat hour)
RevPASH shows how well your space is performing across time. We like this metric because it connects everything from pricing and occupancy to time. A restaurant can be “full” but still underperforming if seat hours aren’t optimised.
For example, if 6–7pm is fully booked but 8–9pm is half empty, reservation pacing or seating strategy might need refinement.
Why it matters
- Measures how efficiently space generates revenue.
- Connects occupancy, pricing, and turnover.
- Optimises peak trading periods.
Formula: Revenue / (seats × operating hours) = Rev per available seat hour
Daily review
- Compare peak vs off-peak performance.
- Identify underperforming hours.
- Adjust booking windows if needed.
No-show & cancellation rate
No-shows aren’t just frustrating, they hurt revenue and waste prep. Checking patterns daily helps spot tricky time slots or booking channels so you can fix issues before they become a bigger problem.
With Now Book It’s Email & SMS features, you can send automated reminders and even share promotions to keep guests engaged. Small tweaks like clearer confirmations can make a big difference. For more tips, see our guide on how to reduce no-shows.
Why it matters
- Prevents lost revenue.
- Impacts staffing and prep costs.
- Supports smarter reservation policies.
Formula: (No-shows / total reservations) × 100 = Cancellation rate
Daily review
- Track same-day cancellations.
- Review patterns by time slot.
- Assess revenue impact.
Back-of-house KPIs
If front-of-house drives revenue, back of house protects it. In our experience working alongside operators, profitability is usually won or lost behind the pass. The kitchens that stay consistent aren’t just cooking well, they’re watching the right numbers daily.
These are the back-of-house KPIs we encourage every operator to review, because small inefficiencies compound quickly.

Food cost percentage
Food cost percentage is one of the clearest indicators of kitchen discipline. When it drifts, margins disappear quietly.
It’s easy to assume rising food cost is “just supplier pricing,” but portion creep, waste, or menu mix shifts are often the real drivers. When monitored daily, small issues are simple to correct. Left unchecked for weeks, they quickly turn into expensive habits.
For a practical breakdown, read our guide on how to calculate food cost percentage and make sure your numbers are working for you.
Why it matters
- Protects margins.
- Detects waste, portion creep, or supplier price fluctuations.
Formula: Cost of goods sold / food revenue × 100 = food cost percentage
Daily review
- Monitor high-margin vs low-margin item performance.
- Spot unusual cost spikes early.
- Flag excessive prep waste.
Labour cost percentage
Labour is often the largest controllable expense. The challenge isn’t cutting hours, it’s aligning them properly with demand.
We regularly see shifts where labour runs high simply because schedules weren’t adjusted to actual covers. On the flip side, understaffing creates service delays that hurt revenue and reviews. Balance is everything.
Why it matters
- Controls one of the largest expenses.
- Prevents overstaffing.
- Protects profitability during slow shifts.
Formula: Total daily labour cost / daily revenue × 100 = labour cost percentage
Daily review
- Compare scheduled vs actual hours.
- Align staffing with covers.
- Flag overtime risks.
Prime cost
Prime cost combines food and labour, your two biggest expenses, into one powerful metric.
We often tell operators: if you only track one back-of-house number daily, make it prime cost. When prime cost is under control, profitability usually follows. When it drifts upward, something in food, labour, or both is misaligned, even if revenue looks strong.
Why it matters
- Combines your two biggest expenses.
- Provides a clear profitability snapshot.
- Signals operational health.
Formula: Food cost + labour cost = prime cost
Daily review
- Ensure prime cost stays within target range.
- Investigate sudden increases immediately.
- Compare against revenue performance.
Inventory variance & waste
Inventory variance shows the gap between what your system says you should have and what’s physically on the shelf. It’s worth tracking because shrinkage, spoilage, and over-portioning compound quietly over time. Most discrepancies aren’t dramatic, they’re small and repeated.
Why it matters
- Prevents shrinkage and loss.
- Protects purchasing accuracy.
- Reduces long-term cost creep.
Formula: Actual inventory – expected inventory = inventory variance
Daily review
- Spot discrepancies in high-value items.
- Track spoilage levels.
- Review prep overproduction.
Ticket time
Ticket time measures how long it takes from order placement to food delivery. It’s worth tracking because it directly connects kitchen efficiency to revenue and guest satisfaction.
Long ticket times don’t just frustrate guests, they reduce table turnover and cap how many covers you can serve during peak hours.
Why it matters
- Impacts guest satisfaction.
- Affects table turnover.
- Reflects kitchen efficiency.
Formula: Average time from order placed to food served = ticket time
Daily review
- Monitor peak service delays.
- Identify bottleneck stations.
- Compare against service standards.
Marketing KPIs
Marketing works best when it’s measurable.
Revenue is the outcome, but reservations, conversions, loyalty, and reputation are the drivers. The most consistent operators focus on these leading indicators daily so they can adjust demand before it becomes a revenue issue.
These are the marketing KPIs worth tracking if you want predictable covers instead of reactive discounting.

Forward reservation volume
Forward reservations give a snapshot of how the next 7–14 days are shaping up. They help you spot slow periods early, so a quiet Wednesday doesn’t turn into lost revenue.
On the other hand, if you have a full house, Now Book It’s waitlist system keeps things flowing. It generates an automated queue so you never have to turn customers away, and cancellations are replaced with revenue, keeping tables full and service smooth.
Why it matters
- Predicts upcoming revenue.
- Supports staffing forecasts.
- Signals demand trends early.
Metric: Total confirmed bookings for upcoming 7–14 days.
Daily review
- Compare pacing vs last week.
- Identify soft periods.
- Trigger promotions if needed.
Booking conversion rate
Conversion rate shows whether website traffic and booking enquiries are actually turning into confirmed covers. High interest doesn’t always equal bookings and small friction points can silently cost revenue.
Unclear availability, too many steps in the booking process, or a poor mobile experience are common culprits. Even simple follow-ups make a difference. Using best practices, like restaurant reservation confirmation email tips, can remove doubt, reduce drop-offs, and turn more visitors into paying guests.
Why it matters
- Measures effectiveness of online presence.
- Improves marketing ROI.
- Identifies friction in booking process.
Formula:
Confirmed reservations / booking enquiries or website visits × 100 = booking conversion rate
Daily review
- Monitor drop-offs in booking funnel.
- Review website usability issues.
- Test promotional performance.
Guest acquisition source
Understanding where bookings originate brings clarity to marketing spend.
Not all channels perform equally. Direct bookings often carry lower costs and stronger long-term value compared to high-commission platforms. Tracking source performance highlights which channels generate both volume and quality.
Why it matters
- Shows where revenue originates.
- Optimises marketing spend.
- Improves targeting decisions.
Metric: Bookings by source channel.
Daily review
- Track top-performing channels.
- Identify declining sources.
- Adjust campaign focus.
Repeat guest rate
Repeat guest rate is all about loyalty and long-term revenue. If repeat visits start to drop, it’s often an early sign that something needs attention — long before overall revenue shows a problem.
Guests who come back regularly usually spend more and respond better to offers, making them easier to serve and more profitable. Keeping track of them with restaurant guest profiles makes it easier to personalise their experience and turn occasional diners into loyal regulars.
Why it matters
- Indicates loyalty strength.
- Reduces reliance on new guest acquisition.
- Increases long-term profitability.
Formula: Returning guests / total guests × 100 = repeat guest rate
Daily review
- Monitor return frequency trends.
- Review impact of loyalty initiatives.
- Identify drop-off patterns.
Online ratings & guest sentiment
Online ratings directly influence bookings. 33% of diners won’t eat at restaurants below 4 stars, and each additional Google star can lift revenue by 5–9%. A small rating drop can quietly impact demand, while improvements often drive noticeable booking growth.
Reviews also serve as an early warning system. Recurring feedback on service or food quality often highlights operational issues before internal reports do, making daily review monitoring a smart performance habit.
Why it matters
- Influences future bookings.
- Acts as an early warning system.
- Impacts brand reputation.
Metric: Average rating across review platforms.
Daily review
- Review new feedback.
- Spot recurring service issues.
- Respond promptly to negative reviews.
Make daily decisions with confidence
Running a restaurant is fast-paced and unpredictable, but tracking the right KPIs daily turns guesswork into clarity.
When front of house, back of house, and marketing data are visible in real time, you can act before small issues become big problems, from managing covers and revenue to controlling labour and boosting repeat business.
That’s why we built Now Book It to bring reservations, guest data, and performance reporting into one clear, real-time dashboard.
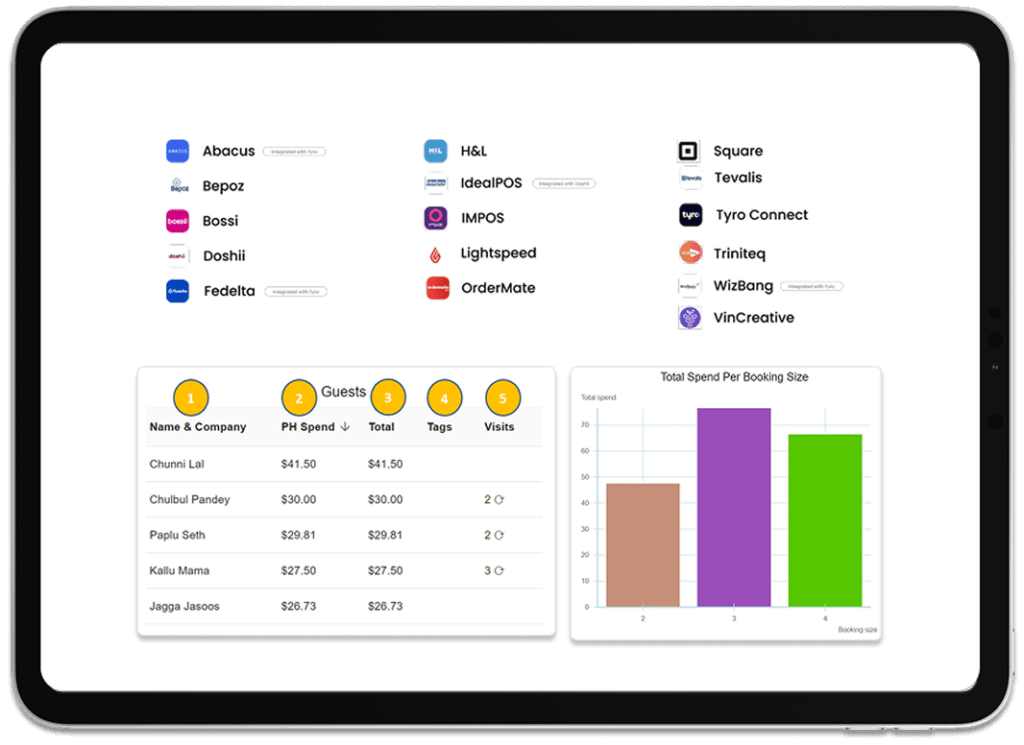
With easy integration to your existing POS, our dashboard showcases the vital data you need, from customer spend to number of visits per guest and total spend per booking size.