
NEW: Increase revenue and save tim e with automated CRM and AI reporting Insights. Learn more ➜
Customer Login:
Built for hospitality, powered by AI.
Now Book It automates your restaurant reservations, guest marketing, and reporting so nothing falls through the cracks.

With full control over your customer database, no commission fees per booking, and the best-in-class customer support around the clock.
Restaurants collect up to 50% more data the minute they switch to Now Book It, and that data always stays with you.
Send automated emails and SMS campaigns that re-engage guests, building direct relationships that keep them coming back.
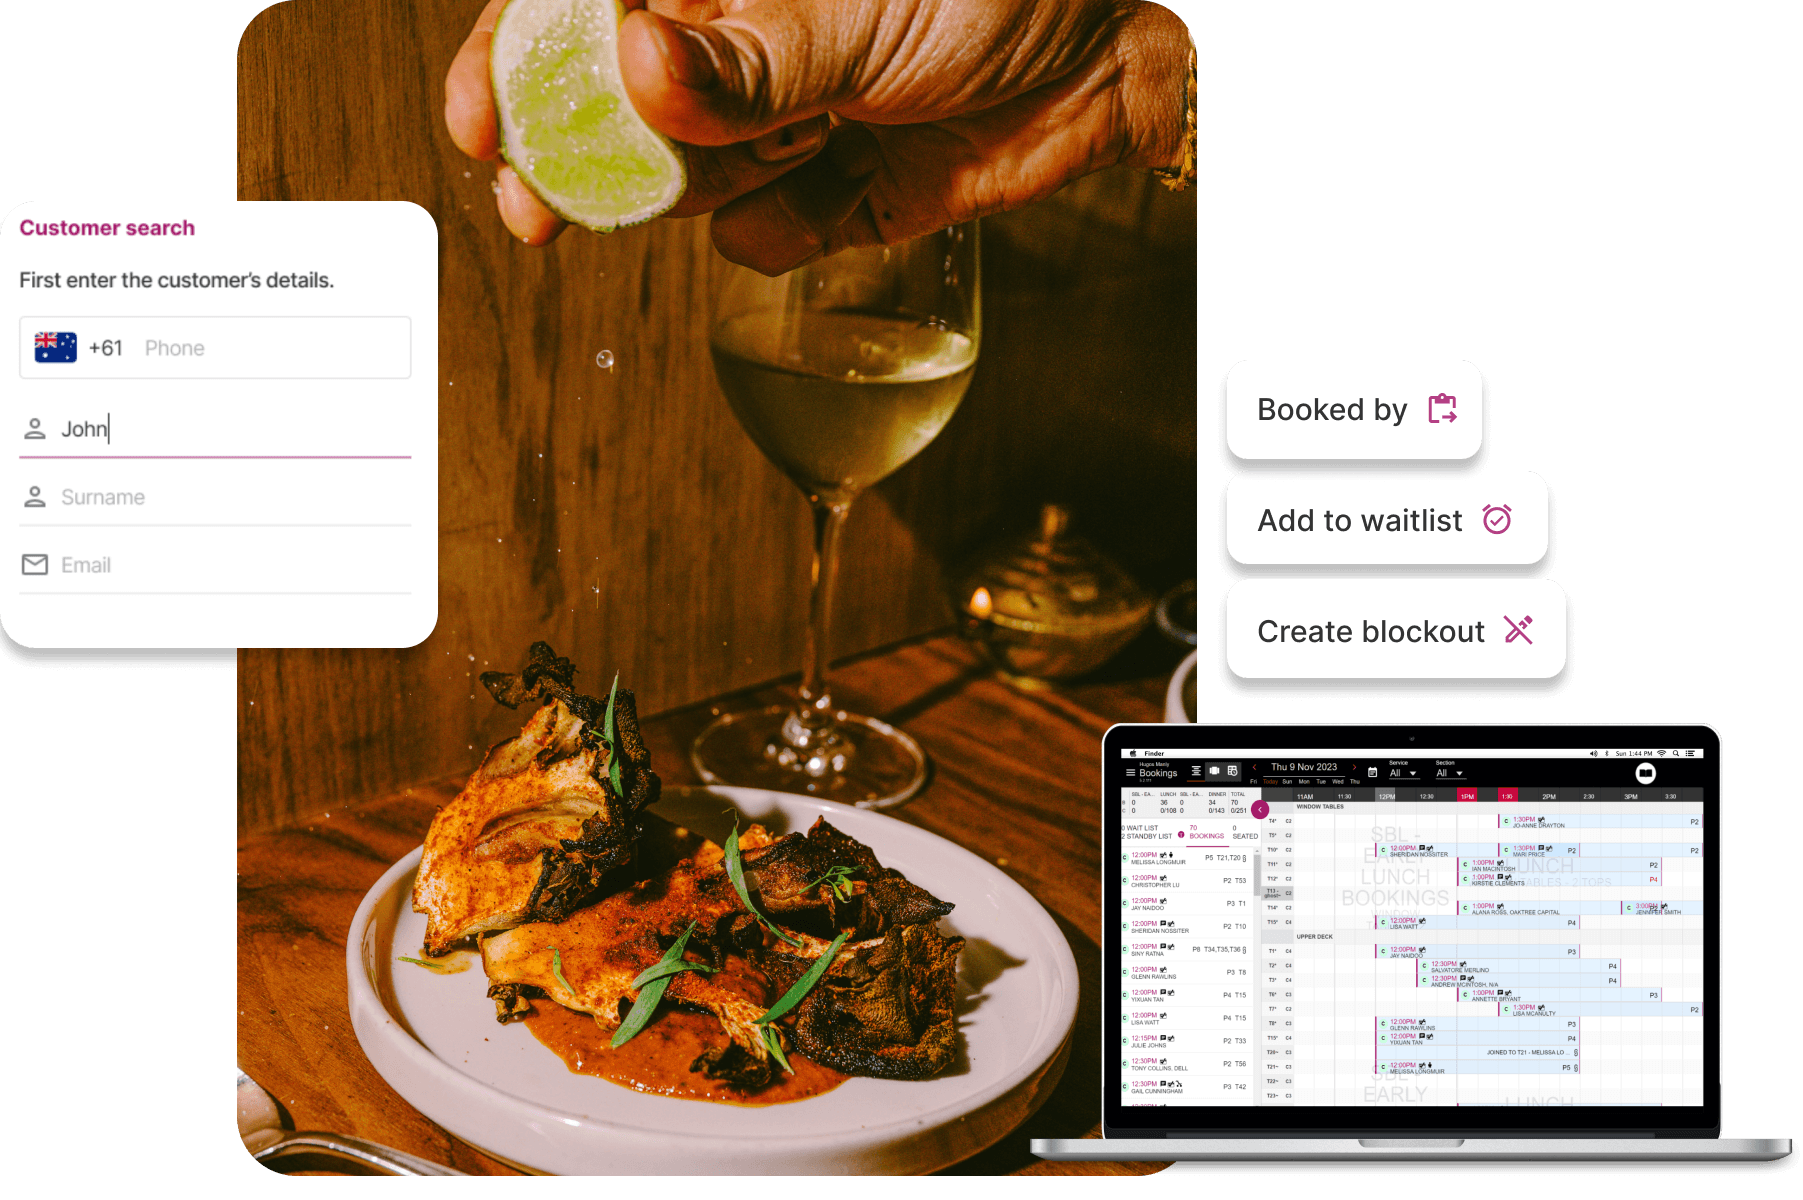
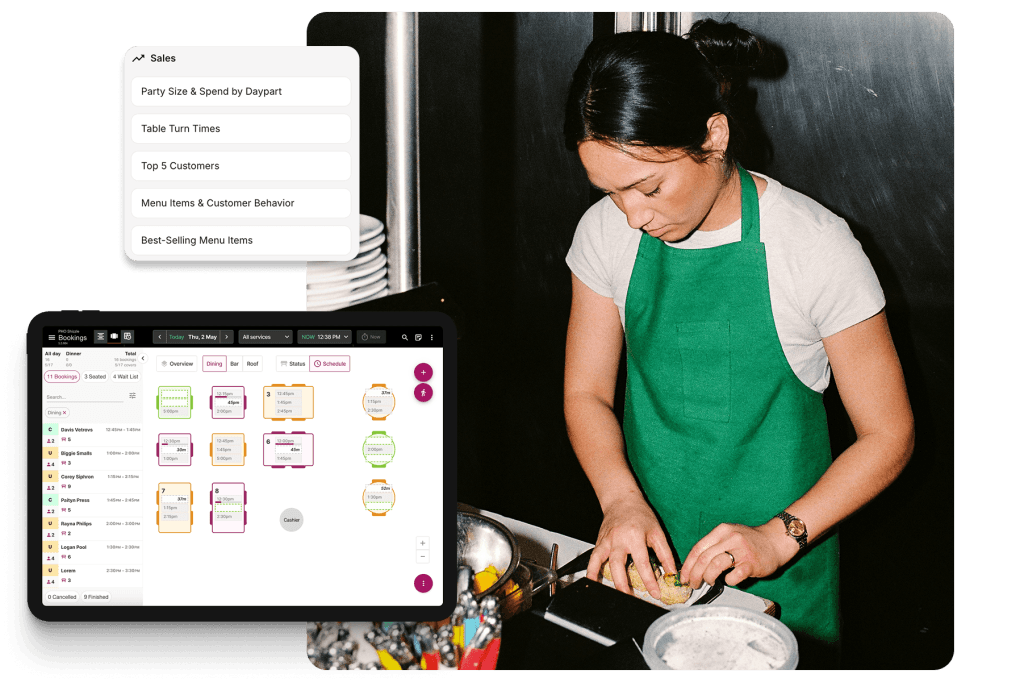
Do more with your data using instant answers, automated end-of-day reporting, and AI powered recommendations.
Every call gets answered with Sadie on the line, and every booking lands even if your team is busy serving customers or off their shift.

Customizable online reservation widget designed to look like your brand, making it quick, easy and memorable for diners
Real-time, flexible floor plans that allow you to manage tables and seat guests more efficiently
Never turn guests away—offer standby bookings and automated reminders during busy periods

Streamline operations across multiple restaurants and keep tabs on your reservations and revenue as a group
Let customers book any of your venues with a single widget, and lead the way to your other locations when one is full
Drive return visits, promote events and functions, and increase gift card sales with data-driven marketing
Helps cafe owners and staff optimise their floor plan, maximise covers and seat guests more efficiently
Leverage your following and attract more customers by taking direct bookings on social media in just 2 clicks
Add a morning coffee, avocado toast, or dessert options to booking forms to increase spending

Online booking system with customisable widgets for pub, club and bar guests to make reservations easily
Diversify revenue streams with the ability to offer events and experiences within your reservation system
Carve out tables for regulars, set up new sections and adapt your floor plan with ease for a smooth service

Diversify revenue streams with the ability to offer events and experiences within your reservation system
Connect all your solutions into the one place to make data-driven decisions and promote growth
Let guests pre-order their favourite bottle of wine or a grazing platter to perfect the experience
Customisable online reservation widget designed to look like your brand, making it quick, easy and memorable for diners
Real-time, flexible floor plans that allow you to manage tables and seat guests more efficiently
Never turn guests away—offer standby bookings and automated reminders during busy periods
Drive return visits, promote events and functions, and increase gift card sales with data-driven marketing
Helps cafe owners and staff optimise their floor plan, maximise covers and seat guests more efficiently
Add a morning coffee, avocado toast, or dessert options to booking forms to increase spending
Online booking system with customisable widgets for pub, club and bar guests to make reservations easily
Diversify revenue streams with the ability to offer events and experiences within your reservation system
Let guests pre-order their favourite bottle of wine or a grazing platter to perfect the experience
Take bookings directly from your own website or social media channel with our white-labelled solution.
Restaurants gain up to 50% more data by moving to Now Book It and that data stays with you.
24/7 local support options that suit your needs, plus dedicated account management.
Never pay per booking fees, ever. Now Book It keeps profits in your pocket with a flat monthly subscription.
11,000+ restaurants use Now Book It to manage reservations and more.

The gap that most venues live in is knowing things are going well (or not), but not knowing why. And...


Request a free demo and learn how our all-in-one hospitality solution can help your business.
Have a question? Contact sales
By submitting this form you accept Now Book It’s Privacy Policy